India me solar energy ab sirf ek alternative nahi, balki long-term energy strategy ka core ban chuki hai. Bijli ki demand har saal badh rahi hai, fossil fuel mehnga ho raha hai, aur climate pressure global level par real hai. Isi context me log sabse zyada search karte hain: asia ka sabse bada solar plant kahan hai, bharat ka sabse bada solar plant, solar panel ki jankari, solar panel ki kimat, sabse sasta solar panel, solar panel kaise banate hain, aur pradhan mantri solar yojana kya hai.
Is article me hum in sab sawalon ka detailed, research-backed jawab denge, practical angle se.
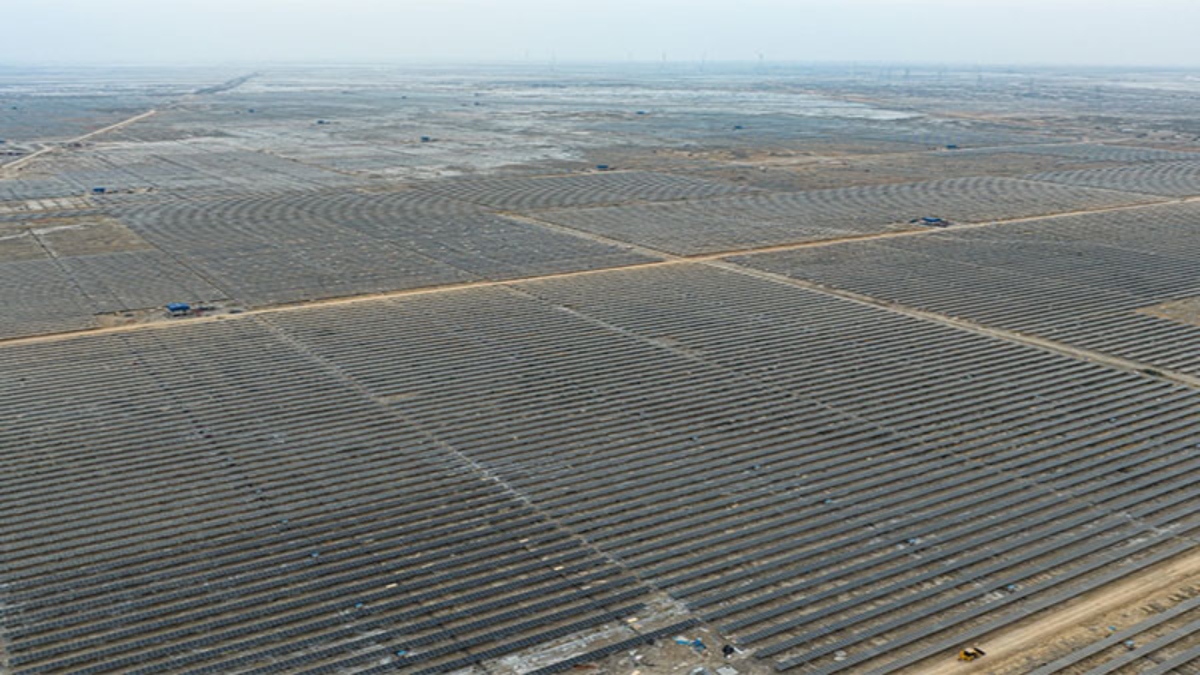
Asia ka Sabse Bada Solar Plant Kahan Hai

Agar sawal hai asia ka sabse bada solar plant kahan hai, to jawab hai Rajasthan ke Jodhpur district me sthit Bhadla Solar Park. Iski total capacity lagbhag 2,245 megawatt (MW) hai. Yeh project multiple phases me develop hua aur extreme desert temperature ke bawajood efficient production deta hai.
Is plant ki scale samajhne ke liye ek simple math dekhiye. Agar average ghar ko 1–2 kW load chahiye, to 2,245 MW ka matlab hai lakhon gharon ko power supply. Yani ek hi project se ek chhote rajya ki residential demand ka bada hissa cover ho sakta hai.
Psychologically dekhen to scale trust build karta hai. Jab log dekhte hain ki desert me itna bada project profitable chal raha hai, to rooftop solar me invest karne ka confidence badhta hai.
Bharat ka Sabse Bada Solar Plant

Aaj ke time par bharat ka sabse bada solar plant Gujarat ke Kutch district me develop ho raha hai, jise Khavda Solar Park ke naam se jaana jata hai. Iski planned capacity 30 GW tak batayi gayi hai (renewable mix including solar + wind). Yeh project global level par bhi sabse bade renewable parks me se ek maana ja raha hai.
Yeh sirf ek plant nahi, balki energy transition ka signal hai. Bharat ne 2030 tak 500 GW renewable target rakha hai. Khavda jaise mega projects is equation ka base layer hain.
Energy ko equation ki tarah dekhen:
Generation – Losses = Net Supply
Jitna bada generation base, utni stability grid me.
Solar Panel Ki Jankari
Ab basic sawal: solar panel ki jankari kya hai? Solar panel ek device hai jo sunlight ko direct current (DC) electricity me convert karta hai, photovoltaic effect ke through.
Iske main components hote hain silicon solar cells, tempered glass, EVA encapsulant, backsheet aur aluminum frame. Jab sunlight silicon par girti hai, to electrons excite hote hain aur current generate hota hai.
Solar system ke core components hote hain panel, inverter, mounting structure, DC/AC wiring aur optional battery.
Agar aap ghar ke liye solar lagana chahte hain to pehle load calculation karein. Example:
Daily consumption 10 units (kWh) hai, to roughly 3 kW ka system sufficient hota hai, depending on sunlight hours.
Yeh simple ratio hai:
Daily Units ÷ 4 = Approx kW required (India ke average 4 peak sun hours ke hisab se).
Solar Panel Kitne Watt Ka Hota Hai
Log puchte hain solar panel kitne watt ka hota hai. Market me commonly 100W, 200W, 330W, 440W, 550W tak ke panels milte hain. Rooftop residential systems me 440W ya 550W mono PERC panels zyada use hote hain.
Commercial projects me high watt bifacial modules use kiye jate hain, jo dono side se sunlight capture karte hain.
Solar Panel Ki Kimat
Ab sabse practical sawal: solar panel ki kimat kya hai?
India me rooftop solar system ki average cost 40,000 se 60,000 rupaye per kW ke beech hoti hai (subsidy se pehle).
3 kW system ki total cost lagbhag 1.5 lakh tak ho sakti hai. Subsidy ke baad effective cost kam ho jati hai.
Agar aap sirf panel kharid rahe hain, to per watt price 20–35 rupaye tak vary karta hai, brand aur technology par depend karta hai.
Yeh ek investment hai jiska ROI 4–6 saal me aa sakta hai, aur panels 25 saal tak chalte hain. Matlab long-term compounding benefit.
Sabse Sasta Solar Panel
Sabse sasta solar panel generally polycrystalline technology ka hota hai. Lekin sasta hamesha best nahi hota. Efficiency thodi kam hoti hai, to rooftop area zyada chahiye.
Decision equation simple hai:
Lower Price + Lower Efficiency = Higher Space Requirement
Higher Price + Higher Efficiency = Less Space, Better Output
Long-term me mono PERC panels better return dete hain.
Solar Panel Kaise Banate Hain
Ab technical angle: solar panel kaise banate hain.
Silicon sand ko refine karke high purity silicon banaya jata hai. Fir ingot banta hai, use thin wafers me cut kiya jata hai. Wafers ko doping process se treat karke PN junction create hota hai.
Cells ko series me solder karke panel layout banaya jata hai, upar glass aur neeche backsheet se laminate kiya jata hai. Fir aluminum frame aur junction box lagta hai.
Manufacturing me precision aur quality control critical hota hai, kyunki micro cracks performance ko impact karte hain.
India me PLI scheme ke through domestic manufacturing ko push diya ja raha hai.
Solar Panel Banane Wali Company
India me kai reputed solar panel banane wali company hain jaise Multi-Solar, Tata Power Solar aur Adani Solar.
In companies ka focus high efficiency modules, domestic supply chain aur export market par hai.
Brand selection karte waqt warranty, degradation rate aur service network check karna zaroori hai.
Pradhan Mantri Solar Yojana aur Pradhan Mantri Solar Panel Yojana


Log commonly search karte hain pradhan mantri solar yojana ya pradhan mantri solar panel yojana. Current initiative ka naam hai PM Surya Ghar: Muft Bijli Yojana.
Is scheme ka goal hai residential rooftop solar ko promote karna aur subsidy provide karna. 3 kW tak ke systems par subsidy mil sakti hai, jo cost ka significant part cover karti hai.
Psychologically subsidy barrier ko todti hai. Jab upfront cost kam hoti hai, adoption rate exponentially badhta hai. Economics me ise demand stimulation kehte hain.
Future of Solar in India
India me solar adoption ek S-curve follow kar raha hai. Shuru me slow growth, fir rapid acceleration, aur fir maturity phase. Abhi hum acceleration phase me hain.
Electric vehicles, green hydrogen aur battery storage solar ke ecosystem ko aur strong karenge.
Agar aap marketer hain ya entrepreneur, to solar sirf product nahi, ek 25 saal ka recurring narrative hai. Energy independence emotional trigger hai. Log power cut aur high bill se frustrated hote hain. Solar unhe control ka feeling deta hai.
Solar Terminology aur Glossary
Photovoltaic Effect: Process jisme sunlight se direct electricity generate hoti hai.
DC (Direct Current): Solar panel se nikalne wali raw current.
AC (Alternating Current): Ghar me use hone wali electricity.
Inverter: Device jo DC ko AC me convert karta hai.
Mono PERC: High efficiency solar cell technology.
Polycrystalline: Older, lower cost solar technology.
Bifacial Module: Dono side se sunlight capture karta hai.
Net Metering: System jisme extra electricity grid ko bechi ja sakti hai.
kW (Kilowatt): Power capacity unit.
kWh (Kilowatt-hour): Energy consumption unit.
Degradation Rate: Har saal panel output kitna reduce hota hai.
Grid-Tied System: Battery ke bina direct grid connected system.
Off-Grid System: Battery based independent system.